Appendix 7 - Environmental Justice Report
The EPA’s Environmental Justice Community Report provides environmental and socioeconomic information for user-defined areas and combines that data into environmental justice and supplemental indexes. The EJScreen tool produced the report below on August 30, 2024.
 To explore these Environmental Justice indicators on your own, including maps depicting where these indicators are concentrated in Washoe County and elsewhere, visit the EPA's Environmental Justice Screening and Mapping Tool. (Note: in early February, 2025, the Trump Administration removed the EPA's EJ Screen tool. If you are interested in exploring the data, the Public Environmental Data Project, the Open Environmental Data Project and others are working to keep these publicly funded data available.)
County Statistics: Washoe County has a population of 486,674 people over 6,540.84 square miles.
|
Community Information
|
|
|
Low income |
26% |
|
People of color |
40% |
|
Less than high school education |
12% |
|
Limited English households |
3% |
|
Unemployment |
5% |
|
Persons with disabilities |
12% |
|
Male / Female |
51% / 49% |
|
Average Life Expectancy |
78 years |
|
Per capita income |
$44,448 |
|
Number of households |
192,420 |
|
Owner occupied households |
59% |
Breakdown by Race: White (60%), Hispanic (25%), Asian (5%), Black (2%), American Indian (1%), Hawaiian / Pacific Islander (1%), Other race (0%), Two or more races (4%)
Breakdown by Age: From ages 1 to 4 (6%), from ages 1 to 18 (21%), from ages 18 and up (79%), from ages 65 and up (17%).
Limited English Speaking Breakdown: Speak Spanish (69%), Speak other Indo-European Languages (11%), Speak Asian-Pacific Island Languages (17%), Speak Other Languages (3%).
Languages Spoken at Home: English (78%), Spanish (16%), Other Indo-European (1%), Chinese (including Mandarin, Cantonese) (1%), Tagalog (including Filipino) (2%), Other Asian and Pacific Island (1%), Other and Unspecified (1%), Total Non-English (22%).
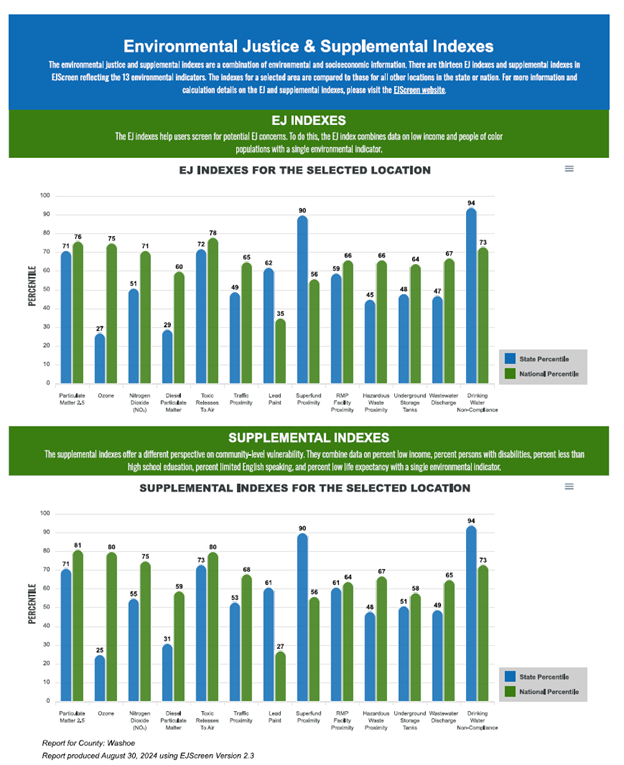
EJ Indexes The EJ indexes help users screen for potential EJ concerns. To do this, the EJ index combines data on low income and people of color populations with a single environmental indicator.
Supplemental Indexes The supplemental indexes offer a different perspective on community-level vulnerability. They combine data on percent low income, percent persons with disabilities, percent less than high school education, percent limited English speaking, and percent low life expectancy with a single environmental indicator.
|
Environmental & Supplemental Indexes |
||||
|
Environmental Indicator |
EJ State Percentile |
EJ National Percentile |
Sup. State Percentile |
Sup. National Percentile |
|
Particulate Matter 2.5 |
71 |
76 |
71 |
81 |
|
Ozone |
27 |
75 |
25 |
80 |
|
Nitrogen Dioxide (NO2) |
51 |
71 |
55 |
75 |
|
Diesel Particulate Matter |
29 |
60 |
31 |
59 |
|
Toxic Releases to Air |
72 |
78 |
73 |
80 |
|
Traffic Proximity |
49 |
65 |
53 |
68 |
|
Lead Paint |
62 |
35 |
61 |
27 |
|
Superfund Proximity |
90 |
56 |
90 |
56 |
|
RMP Facility Proximity |
59 |
66 |
61 |
64 |
|
Hazardous Waste Proximity |
45 |
66 |
48 |
67 |
|
Underground Storage Tanks |
48 |
64 |
51 |
58 |
|
Wastewater Discharge |
47 |
67 |
49 |
65 |
|
Drinking Water Non-Compliance |
94 |
73 |
94 |
73 |
|
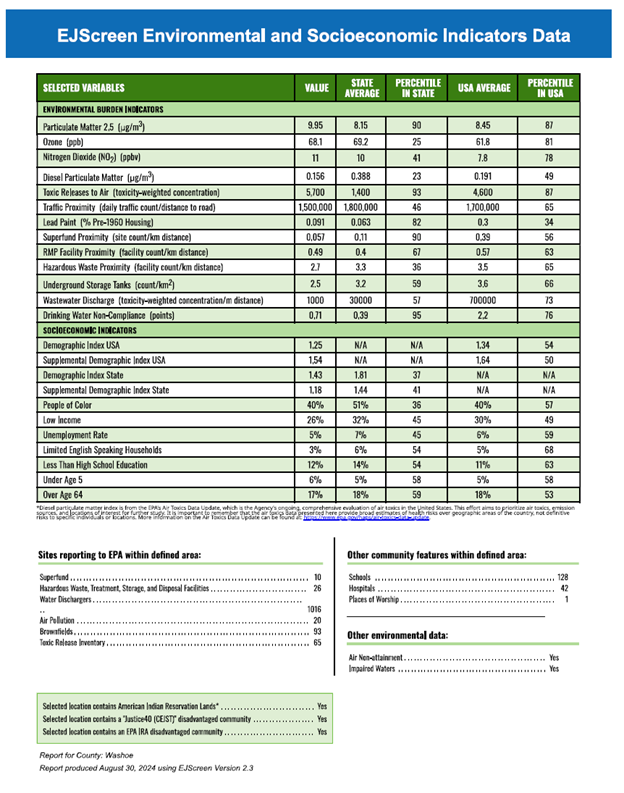
EJ Screen Environmental Indicators Data |
|||||
|
Selected Variables |
Value |
State Average |
Percentile in State |
USA Average |
Percentile in USA |
|
Particulate Matter 2.5 (m/m3) |
9.95 |
8.15 |
90 |
8.45 |
87 |
|
Ozone (ppb) |
68.1 |
69.2 |
25 |
61.8 |
81 |
|
Nitrogen Dioxide (NO2) (ppbv) |
11 |
10 |
41 |
7.8 |
78 |
|
Diesel Particulate Matter (m/m3) |
0.156 |
0.388 |
23 |
0.191 |
49 |
|
Toxic Releases to Air (toxicity-weighted concentration) |
5,700 |
1,400 |
93 |
4,600 |
87 |
|
Traffic Proximity (daily traffic count / distance to road) |
1,500,000 |
1,800,000 |
46 |
1,700,000 |
65 |
|
Lead Paint (% Pre-1960 Housing) |
0.091 |
0.063 |
82 |
0.3 |
34 |
|
Superfund Proximity (site count / km distance |
0.057 |
0.11 |
90 |
0.39 |
56 |
|
RMP Facility Proximity (facility count / km distance) |
0.49 |
0.4 |
67 |
0.57 |
63 |
|
Hazardous Waste Proximity (Facility count / km distance) |
2.7 |
3.3 |
36 |
3.5 |
65 |
|
Underground Storage Tanks (count / km2) |
2.5 |
3.2 |
59 |
3.6 |
66 |
|
Wastewater Discharge (toxicity-weighted concentration / m distance) |
1000 |
30,000 |
57 |
700,000 |
73 |
|
Drinking Water Non-Compliance (points) |
0.71 |
0.39 |
95 |
2.2 |
76 |
|
EJ Screen Socioeconomic Indicators Data |
|||||
|
Selected Variables |
Value |
State Average |
Percentile in State |
USA Average |
Percentile in USA |
|
Demographic Index USA |
1.25 |
N/A |
N/A |
1.34 |
54 |
|
Supplemental Demographic Index USA |
1.54 |
N/A |
N/A |
1.64 |
50 |
|
Demographic Index State |
1.43 |
1.81 |
37 |
N/A |
N/A |
|
Supplemental Demographic Index State |
1.18 |
1.44 |
41 |
N/A |
N/A |
|
People of Color |
40% |
51% |
36 |
40% |
57 |
|
Low Income |
26% |
32% |
45 |
30% |
49 |
|
Unemployment Rate |
5% |
7% |
45 |
6% |
59 |
|
Limited English Speaking Households |
3% |
6% |
54 |
5% |
68 |
|
Less Than High School Education |
12% |
14% |
54 |
11% |
63 |
|
Under Age 5 |
6% |
5% |
58 |
5% |
58 |
|
Over Age 64 |
17% |
18% |
59 |
18% |
53 |
|
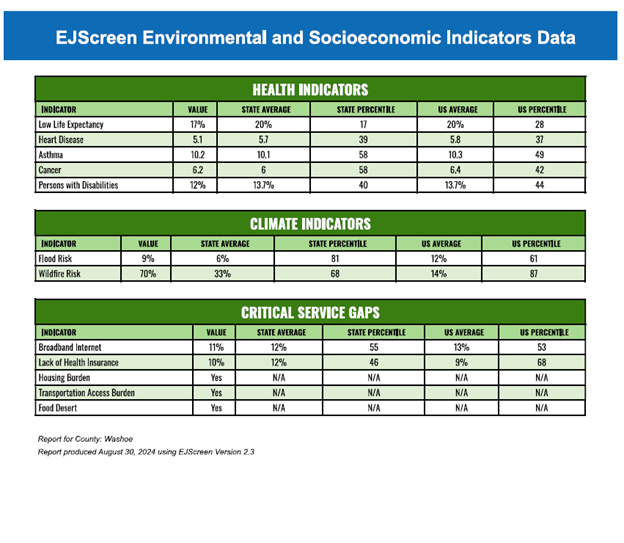
Health Indicators |
|||||
|
Indicator |
Value |
State Average |
Percentile in State |
USA Average |
Percentile in USA |
|
Low Life Expectancy |
17% |
20% |
17 |
20% |
28 |
|
Heart Disease |
5.1 |
5.7 |
39 |
5.8 |
37 |
|
Asthma |
10.2 |
10.1 |
58 |
10.3 |
49 |
|
Cancer |
6.2 |
6 |
58 |
6.4 |
42 |
|
Persons with Disabilities |
12% |
13.7% |
40 |
13.7% |
44 |
|
Climate Indicators |
|||||
|
Indicator |
Value |
State Average |
Percentile in State |
USA Average |
Percentile in USA |
|
Flood Risk |
9% |
6% |
81 |
12% |
61 |
|
Wildfire Risk |
70% |
33% |
68 |
14% |
87 |
|
Critical Service Gaps |
|||||
|
Indicator |
Value |
State Average |
Percentile in State |
USA Average |
Percentile in USA |
|
Broadband Internet |
11% |
12% |
55 |
13% |
53 |
|
Lack of Health Insurance |
10% |
12% |
46 |
9% |
68 |
|
Housing Burden |
Yes |
N/A |
N/A |
N/A |
N/A |
|
Transportation Access Burden |
Yes |
N/A |
N/A |
N/A |
N/A |
|
Food Desert |
Yes |
N/A |
N/A |
N/A |
N/A |
Back: Appendix 6 - Cost of Living Data Next: Appendix 8 - Washoe County Temperatures